01 BarTrack 02 Nissan 03 Big Tech Client 04 Southwest 05 naviHealth 06 HCA
Case Study 01 — BarTrack × NuCO2

A New Market Pivot: IoT Monitoring for NuCO2's National Retail Footprint

Client
NuCO2 × BarTrack — via Scenic West
Role
Lead Product Designer / Design Engineer, 0→1

BarTrack's core product monitors beer taps for bars. The NuCO2 partnership is a bet on much bigger territory — CO2 and soda equipment behind thousands of retail locations, starting with 7-Eleven, Whataburger, and Arby's. I was brought on as the sole product designer to turn that bet into a buildable platform: running the stakeholder sessions, designing all four personas end-to-end, and building AI-assisted dev ready prototypes.

"A manager doesn't know if they need to call the CO2 supplier, equipment repair, or Coca-Cola — and calling the wrong one wastes a full day."
— from field stress-testing sessions
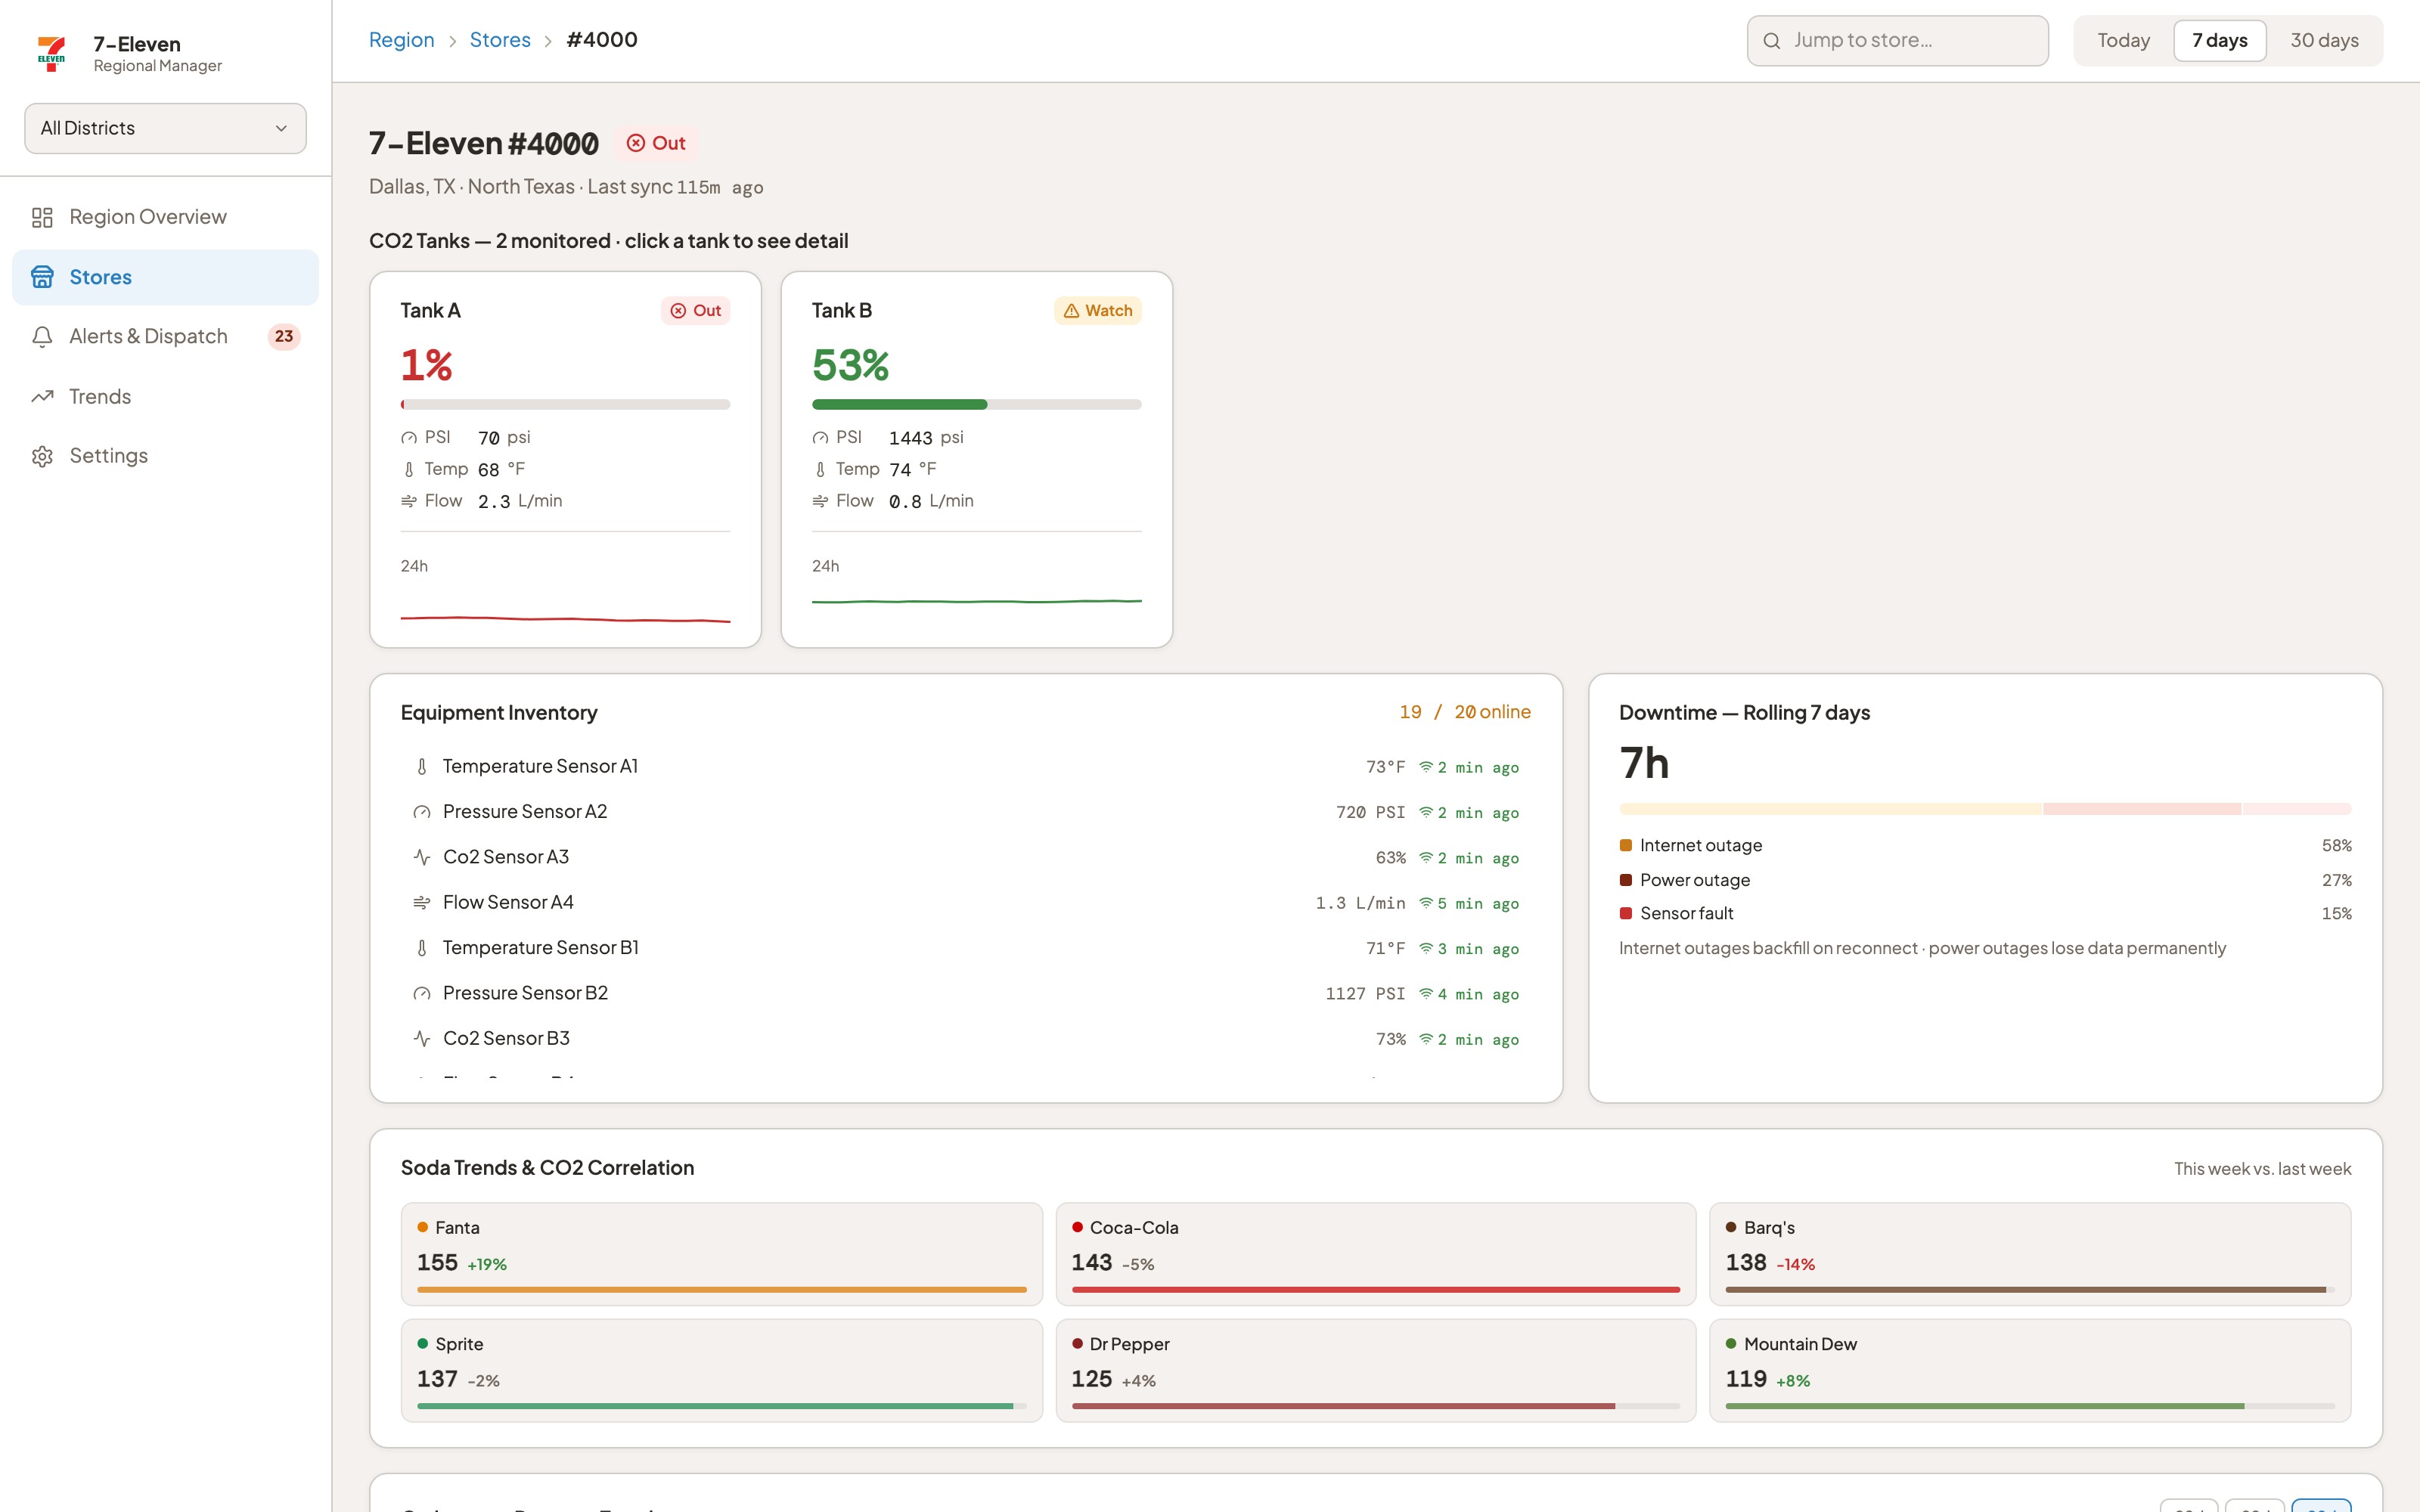
BarTrack regional manager, drilled into a single store showing CO2 tank detail, equipment inventory, downtime breakdown, and soda trend correlation
Regional Manager · Store Drill-In — Tanks, Equipment, Downtime & Soda Trends
Approach

Built with operators, not for them — one stress-tested revision at a time.

  • Weekly working sessions with NuCO2 operations, engineering, and field leadership — specs rewritten three times (v1 → v3) as real pushback surfaced what the first draft got wrong
  • Every story format-checked against how installs, dispatch, and store operations actually run, not how the org chart is drawn
4
Personas Designed End-to-End
Field / Installer Technician
Store Manager
Regional & Corporate Ops
NuCO2 Admin & Dispatch
"The sensors-reporting check isn't a suggestion — it's a gate. A tech doesn't leave until the system confirms it."
— stress-test decision, confirmed by field ops
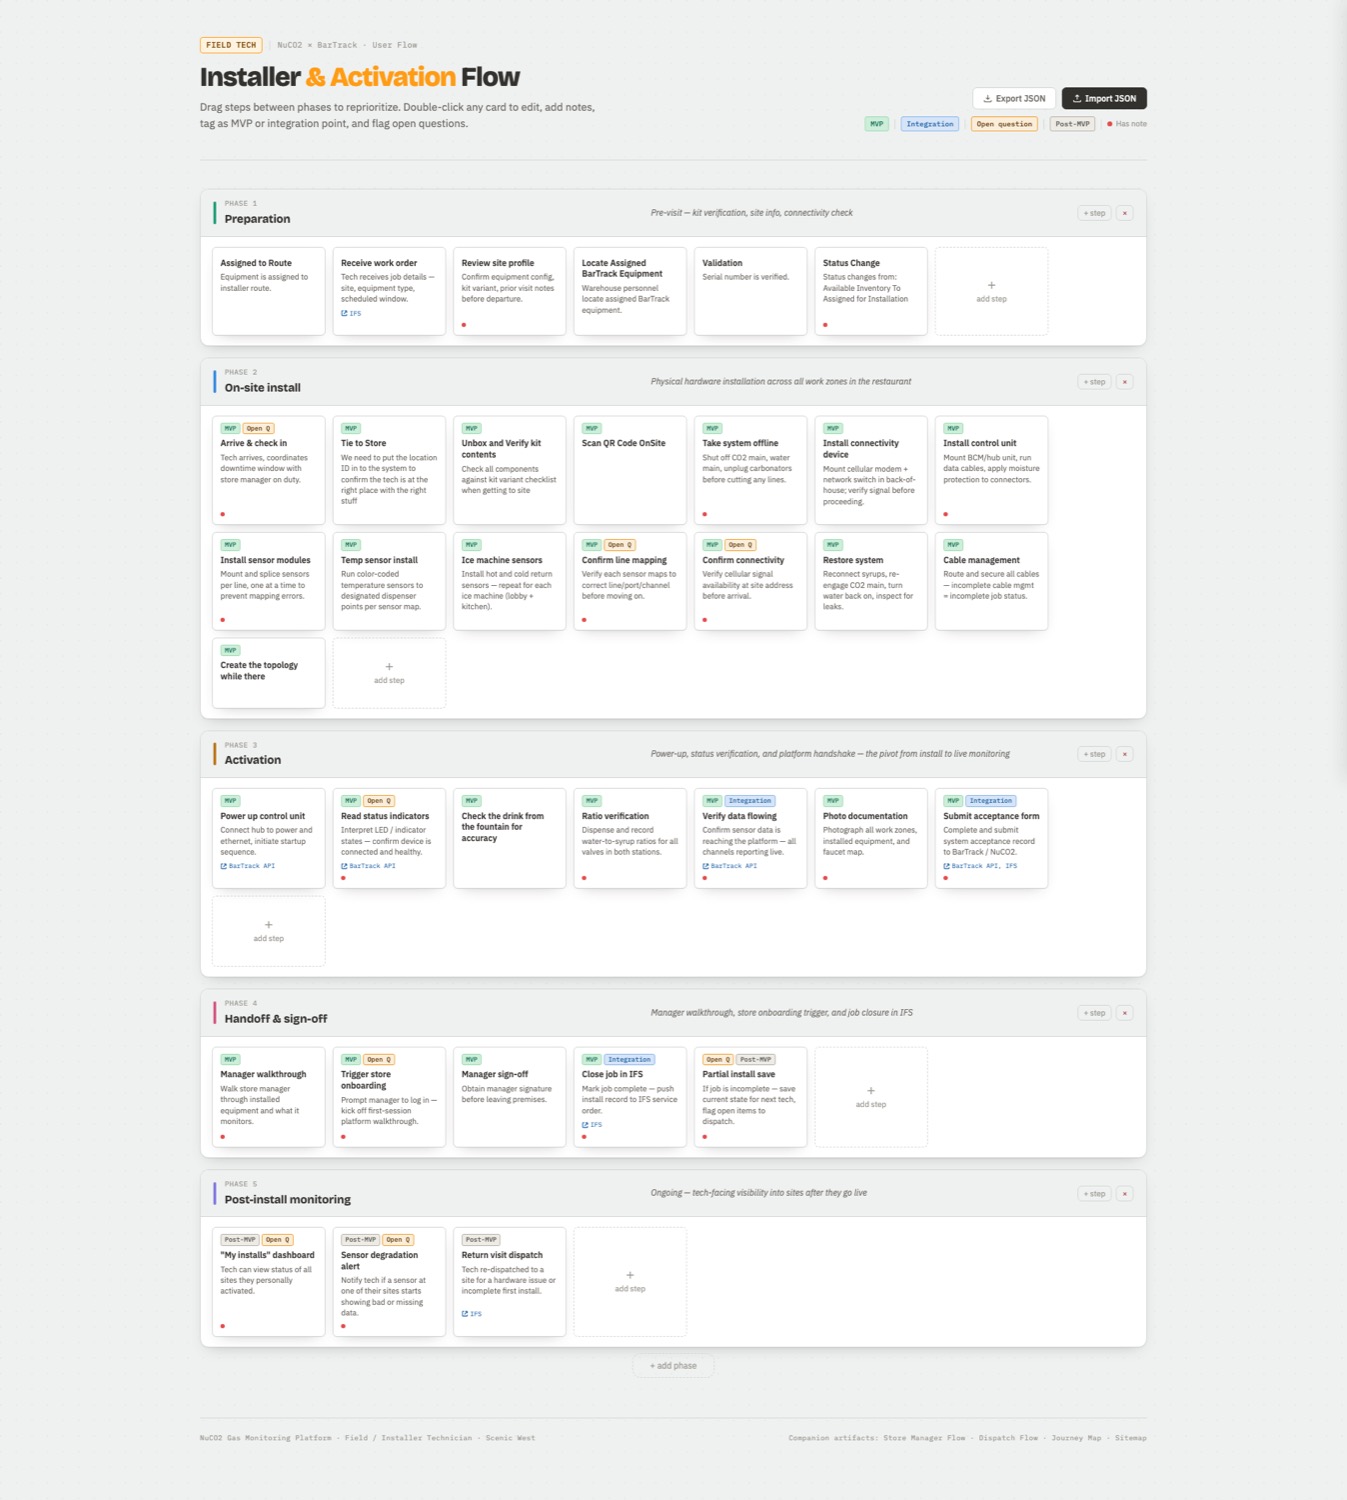
BarTrack installer and activation flow tool with editable, taggable steps across five phases
Installer & Activation Flow · Editable, Taggable, Built for the Room
Artifact — Working Sessions

Past the whiteboard: structured, editable flows built in days, not weeks.

Instead of static decks or free-form whiteboarding, I built each persona's flow as a rapidly-assembled interactive tool — drag steps between phases, double-click any card to edit, tag it MVP / integration point / open question — built in Claude from interview notes and best-guess assumptions, then corrected live in the room. It turned alignment meetings into working sessions: NuCO2 and BarTrack could argue about a specific card instead of a vague impression, and open questions got tracked as data instead of getting lost after the call ended.

→ Open the interactive flow tool
Artifact — System View

Every touchpoint mapped against the system running underneath it.

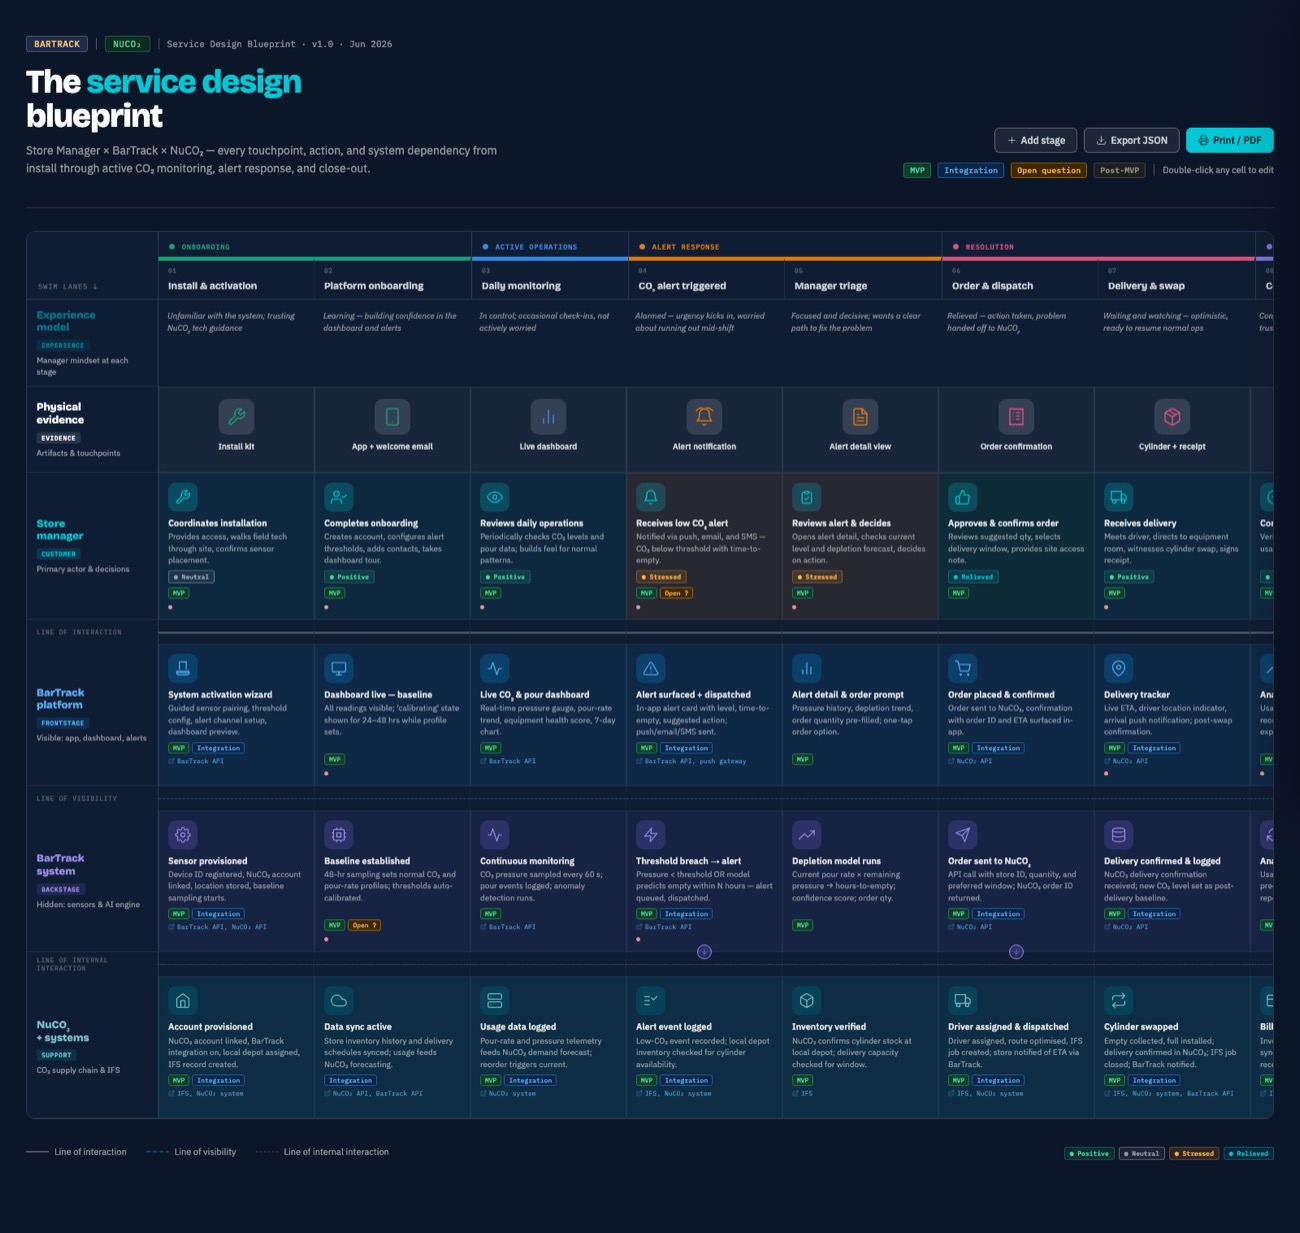
A full service blueprint threaded the store manager's experience — onboarding through alert response through resolution — against three backstage lanes: the BarTrack platform, the "BarTrack system" lane (labeled explicitly as the sensors & AI detection engine reading pressure and pour data in real time), and NuCO2's own dispatch systems. Naming that sensor/AI layer explicitly — instead of leaving it implied — kept the team honest in reviews about what was actually automated versus what only looked automated from the front end.

→ Open the interactive blueprint
BarTrack x NuCO2 service design blueprint across onboarding, monitoring, alert response, and resolution
Service Blueprint · Store Manager Journey, Front Stage to Backstage
The Design Decision

Regional visibility, designed to read as protection, not surveillance.

Corporate wanted fleet-wide uptime visibility. In stress-test sessions, store managers pushed back that real-time alerts to corporate would read as discipline, not support. I resolved it with a grace-period model: local resolution gets a window before anything escalates upward. For the regional view, I chose to frame downtime in dollars protected rather than violations logged.

For Scale Fountain drinks run close to 90 percent margin. A conservative estimate puts a full day of lost CO2 service at $500 to $800 per store, and replacement service is rarely same-day, so a missed call can compound across several days before it gets caught. That is the stake behind the reframe — corporate gets the urgency a dollar figure creates, without turning the store manager's screen into a scoreboard of infractions.
Live prototype  ·  Regional Fleet Map, 500 Locations

The same reframe carried into alerting generally. NuCO2 dispatch gets every alert at the same moment the store manager does, so the store manager's screen had to answer a different question than "what's broken." It had to answer "is this already being handled, and what do I need to do locally."

Live prototype  ·  Single Store Manager, Phone-First
The Design Decision

A region to protect. A store to run. Same platform, two different jobs.

The regional dashboard is a scan-and-triage tool — a fleet of hundreds reduced to what needs attention. A single store manager needed the opposite: depth on the one location they're standing in. That meant tank-by-tank CO2 levels by zone, syrup levels per flavor, per-station dispensing detail, a 30-day supply forecast, and one-tap early reorder when the math doesn't work out — built phone-first, for someone checking between customers, not sitting at a desk. High-turnover store staff also weren't going to create accounts and remember passwords for a screen they'd open twice a shift, so access is QR-first: scan, see live status, no login required.

A separate, smaller ask came from NuCO2 itself: their own admin/ops team needed visibility that nothing on the BarTrack side was falling through the cracks — flagged jobs, onboarding status, tech support queue. That got a lightweight console of its own, not the focus of this case study.

From Comps to Code

A separate call: prototype in the real stack, not just in Figma.

Once the direction was validated, I made a second, distinct decision with BarTrack's dev lead: move key flows out of static comps and into working React / Tailwind / shadcn prototypes, directing Claude Code the way you'd direct an engineer — design decisions mine, implementation AI-augmented. The goal was both a visual polish that held up to real scrutiny, and interactions that actually worked — nailing down real state and edge cases (partial installs, offline queueing, dormant-device activation) before engineering picked it up, so the spec they inherited had already survived contact with a real codebase.
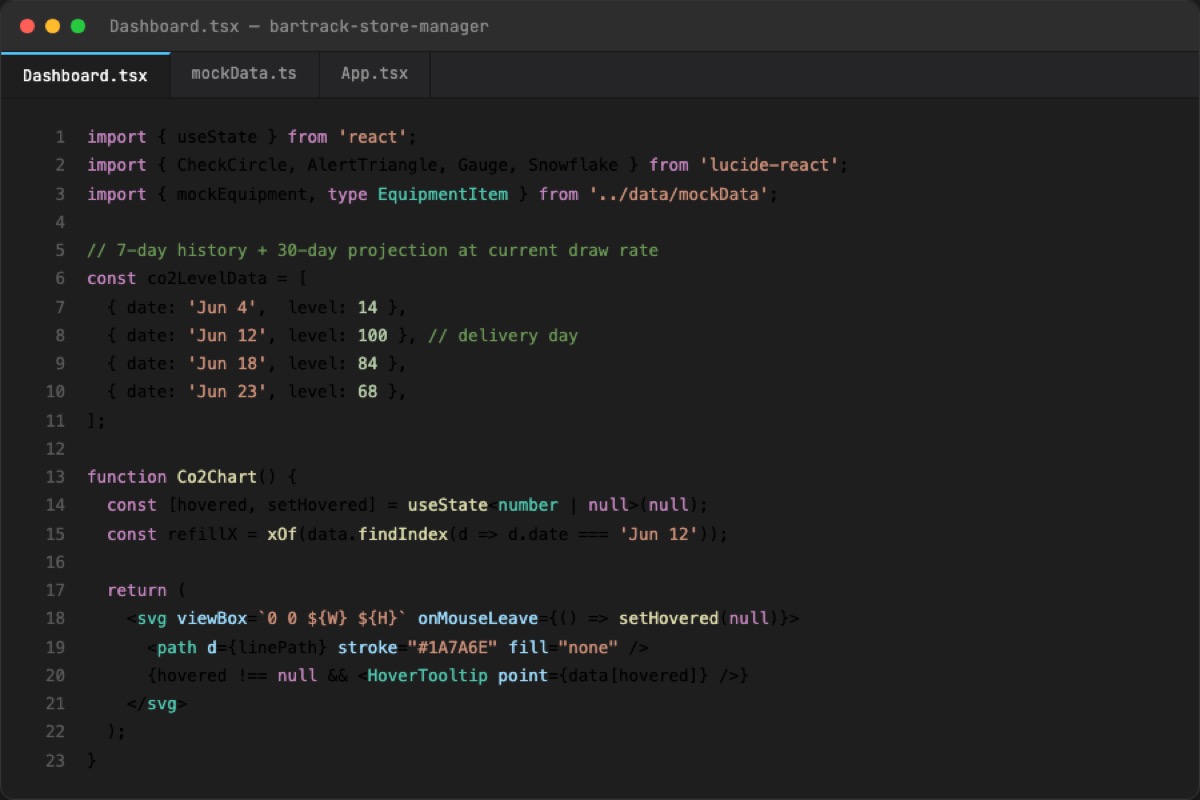
Code view of the BarTrack store manager React prototype, showing the CO2 forecast chart component
Source · CO2 Forecast Chart Component, React + TypeScript
Live prototype  ·  Scan a Fountain, Watch It Auto-Map
AI-Forward Execution

The hardest UX problem got an AI-assisted answer, prototyped in-tool.

The #1 identified challenge was topology mapping — tying each physical dispenser line to the right sensor during install, entirely by hand today. I designed and prototyped a computer-vision "scan & auto-map" flow directly in Figma Make: point the camera at the fountain, the AI reads each label and proposes a mapping with a confidence score per line, and a technician corrects anything it got wrong before confirming — with a full manual-entry fallback for when the scan doesn't hold at all.

Outcome

A stress-tested backlog, handed to engineering as spec — not a deck.

The engagement closed with a research-validated backlog across four personas, a full service blueprint, interactive working-session flows, and AI-assisted working prototypes — the foundation NuCO2 and BarTrack are now building from as the platform moves from spec into engineering, and BarTrack's opening claim on a new market.

4
Personas Designed End-to-End
40+
User Stories Specced & Stress-Tested
9
Weeks, Kickoff to Handoff
Next

02 — Nissan

Continue to the next case study.

→ View Nissan
Switch Experience
Bauhausian Classic Hacker Neo-Brutalist Punk Zine